The GA4 Inspector is a built-in debugging tool in the HT Easy GA4 plugin that helps you validate and troubleshoot your Google Analytics 4 (GA4) implementation.
What It Does
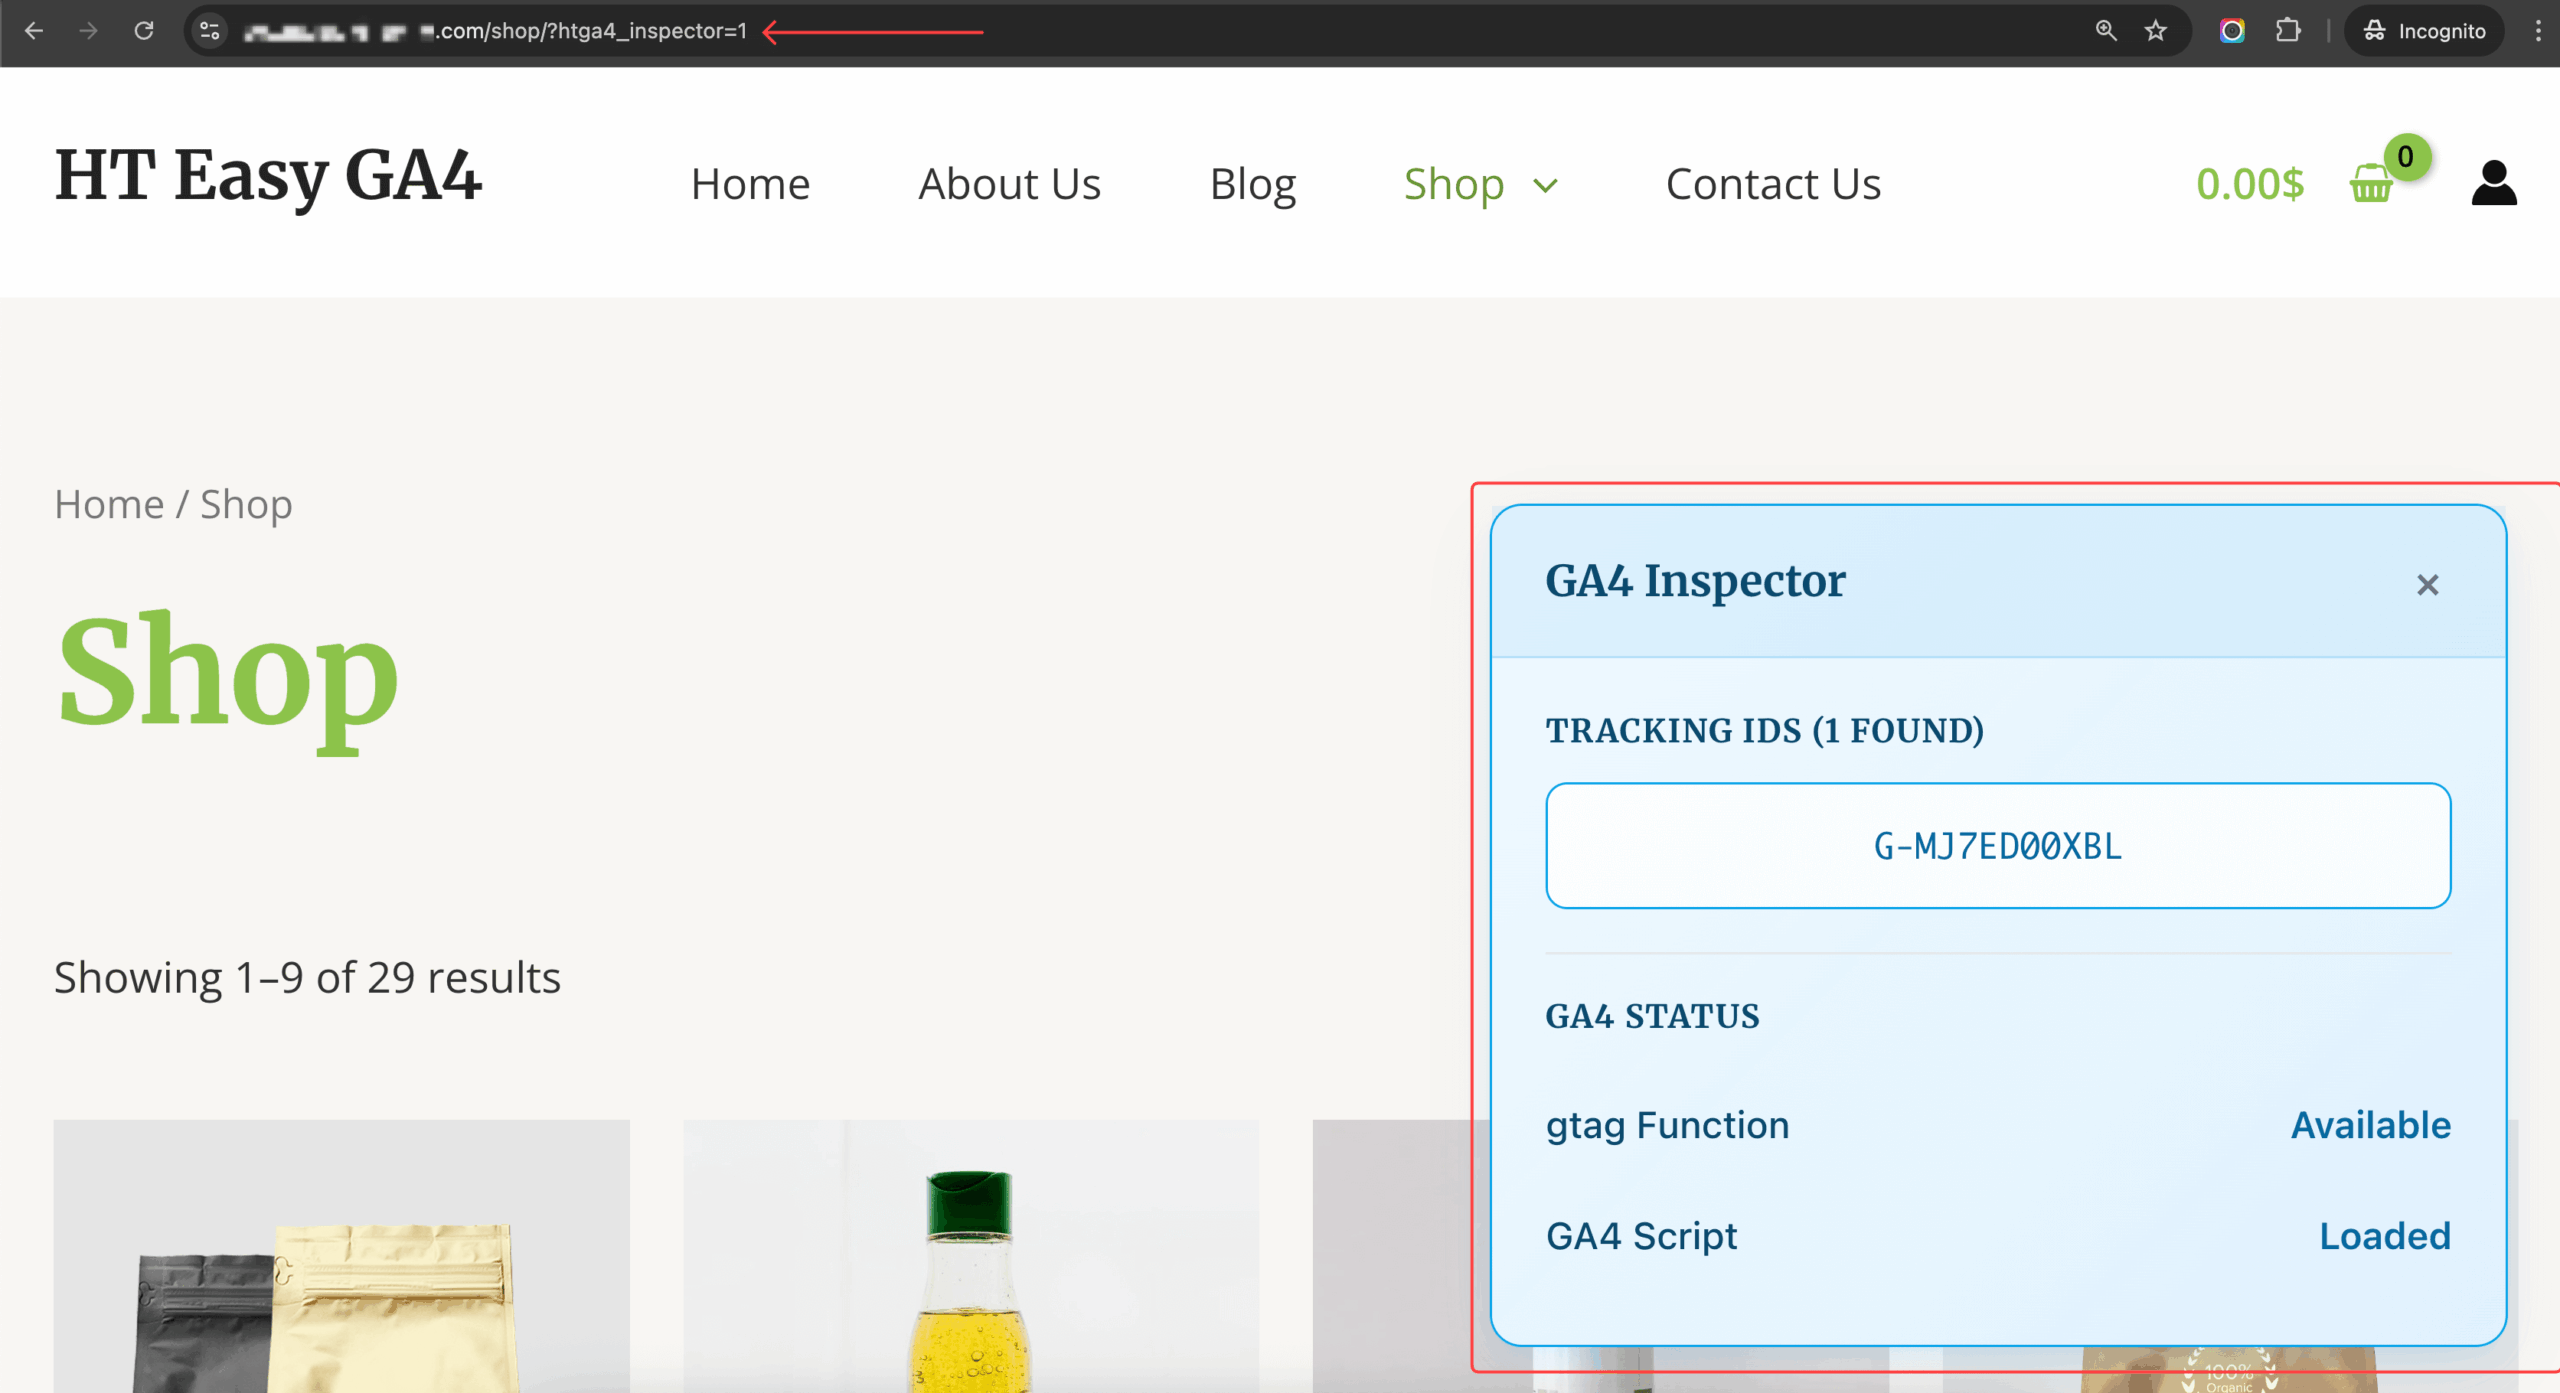
Once enabled, the GA4 Inspector displays a floating debug panel on your website that:
- Detects GA4 Measurement IDs present on the page.
- Checks if the
gtag()function is available and working. - Verifies the GA4 script is properly loaded.
- Confirms if the
dataLayeris present and functioning correctly.
This tool is especially useful for developers, marketers, and site owners who want to ensure that GA4 tracking is functioning as expected.
If you’re using multiple analytics plugins, it’s common to have duplicate GA4 tags, which can affect data accuracy. With this tool, you can easily verify whether multiple tracking codes are installed.
How to Use
- Enable the feature:
- Go to
HT Easy GA4 → Tools. - Toggle the switch labeled Enable GA4 Inspector to turn it on.
- Go to
- Activate the inspector on your website:
- Visit any page on your site and add the following query string to the end of the URL:
?htga4_inspector=1 - Example:
https://yourdomain.com/shop/?htga4_inspector=1 - Another Example:
https://yourdomain.com/?htga4_inspector=1
- Visit any page on your site and add the following query string to the end of the URL:
- View the debug panel:
- A panel labeled GA4 Inspector will appear on the screen.
- It will display the GA4 Tracking ID(s), script status, and other relevant information.
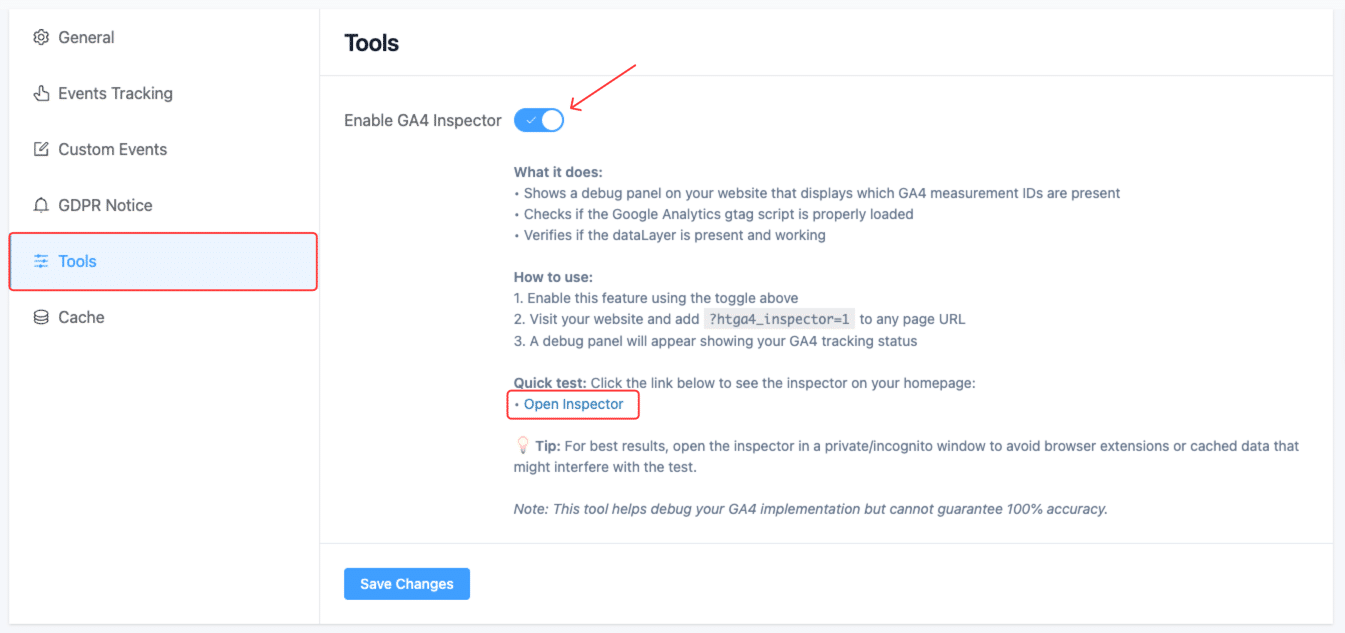
Quick Test Link
To test it instantly on your homepage, click this link (after enabling the feature):
ℹ️ Tip: For best results, open the URL in an incognito/private browser window. This avoids interference from browser extensions or cached scripts that might affect tracking or visibility.
Note
This inspector is a diagnostic tool designed to help identify setup issues with your GA4 implementation. While it provides helpful insights, it cannot guarantee 100% tracking accuracy.