Discover the intricacies of generating and interpreting standard reports through this documentation. Uncover valuable insights for informed decision-making.
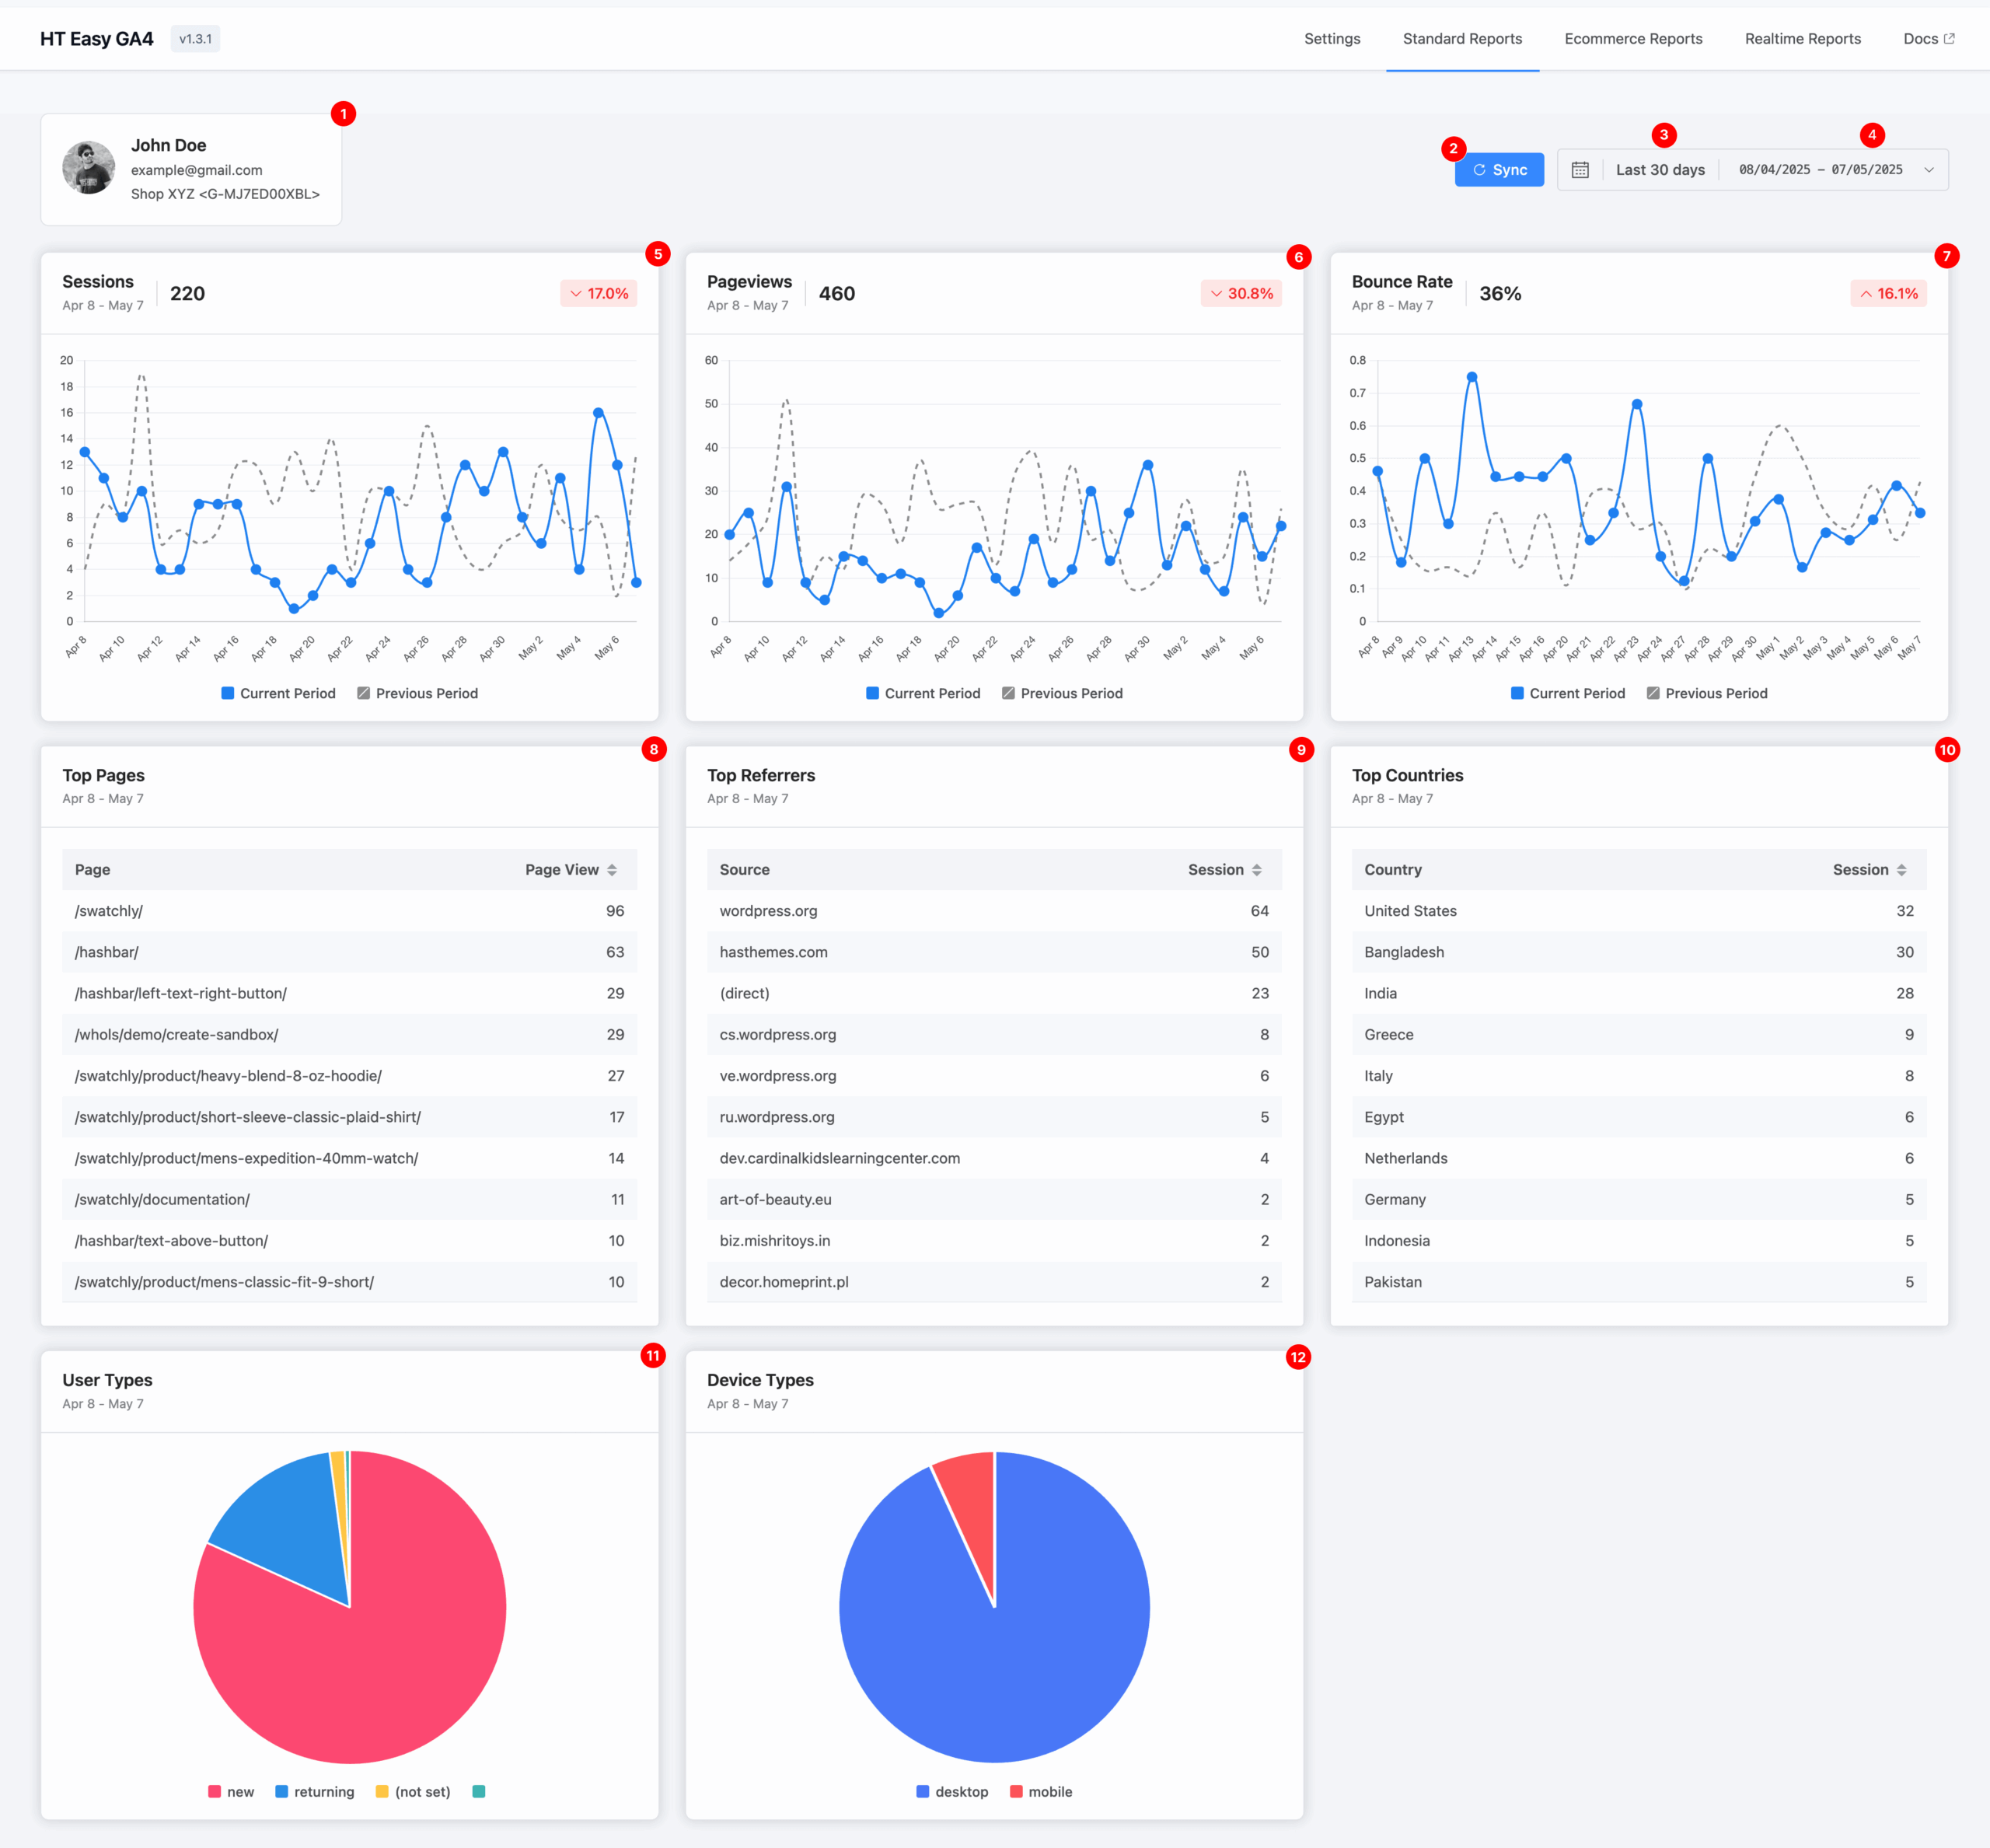
1. Account & Measurement Overview
This section displays:
- The Google account currently authenticated.
- The Measurement ID and associated Data Stream name (e.g., “Shop XYZ”) for the report data.
2. Sync
Click the Sync button to refresh and retrieve the latest data from your GA4 property. This ensures your reports reflect the most current analytics available.
3. Default Date Range
By default, the dashboard shows data from the last 30 days.
This provides a quick snapshot of your site’s recent activity and performance.
4. Custom Date Range Selector
Use the calendar selector to define a custom date range.
This flexibility allows you to analyze data for any specific timeframe—useful for tracking campaign performance, seasonal trends, or historical comparisons.
5. Sessions
A session is a group of user interactions within a single visit to your website.
This metric helps you measure overall engagement and analyze user activity over time.
6. Pageviews
A pageview represents each time a page on your website is loaded.
This helps you track which content attracts the most attention.
7. Bounce Rate
A pageview represents each time a page on your website is loaded.
This helps you track which content attracts the most attention.
8. Top Pages
This section lists the most visited pages on your website within the selected period.
It helps identify high-performing content worth promoting or replicating.
9. Top Referrers
Displays the top external websites that have sent traffic to your site.
This helps evaluate the success of referral sources, backlinks, or campaigns.
10. Top Countries
Shows a breakdown of user sessions by country.
Understanding your audience’s geographic distribution is crucial for targeting and localization efforts.
11. User Types
A visual chart shows two types of visitors:
- New users: First-time visitors
- Returning users: Repeat visitors
Use this to measure audience loyalty and retention.
12. Device Types
Breaks down visitors by device category:
- Desktop
- Mobile
This helps ensure your website delivers a seamless experience across all devices.