How to Track Website Traffic with Google Analytics 4 – Easy, Step‑by‑Step Guide
Tracking website traffic tells you who visits your site, where they come from, and what they do, so you can improve content, UX, and sales. In this guide, you’ll learn how to track website traffic using Google Analytics 4 (GA4), and how to make it easier in WordPress with the HT Easy GA4 plugin.
Quick Answer: How to Track Website Traffic
To track website traffic, create a Google Analytics 4 property, add your Measurement ID or GA4 tag to your site, then use GA4’s Reports → Acquisition to see visitors by channel, source/medium, and campaign.
On WordPress, you can automate this setup and view key reports inside your dashboard with a plugin like HT Easy GA4.
Table of Contents
What You’ll Learn
- How Google Analytics 4 tracks website traffic and key metrics you should watch.
- How to set up GA4 for any website step by step.
- How to find your main traffic sources and traffic for specific pages.
- How to track website traffic in WordPress and WooCommerce using HT Easy GA4.
- Common mistakes to avoid so your data stays clean and trustworthy.
What Is Google Analytics 4?
Google Analytics is Google’s free web analytics platform that measures website and app traffic and user behavior. Since Universal Analytics was sunset, Google Analytics 4 (GA4) is the default version and uses an event-based model instead of page‑view sessions only.
GA4 lets you track traffic, engagement, conversions, and revenue across websites and apps, and you can integrate it with tools like Google Ads and Search Console. As of mid‑2020s, Google Analytics (including GA4) is installed on tens of millions of websites worldwide, making it the most widely used analytics platform.
Note: Google Analytics 4’s standard version is free; Google Analytics 360 is a paid enterprise offering, with contract-based pricing that typically starts in the tens of thousands of dollars per year.[Verify from official source]
Why Tracking Website Traffic Matters?
Tracking website traffic answers practical questions like who visits, how they found you, and whether they convert, so you can make data-driven changes instead of guessing. For WordPress and WooCommerce sites, this means better decisions about content, design, and marketing spend.
Key reasons to track traffic with GA4 include:
- Performance evaluation: See how many users visit, which pages they view, how long they stay, and whether they bounce, helping you identify both high‑performing and weak pages.
- Audience insights: Understand visitors by country, device, and other characteristics so you can tailor copy, offers, and layout (e.g., prioritizing mobile UX if most traffic is mobile).
- Content and SEO optimization: Identify pages with strong traffic and engagement, then replicate what works and improve underperforming content.
- Marketing and budget allocation: Compare organic search, paid ads, social, email, and referral traffic to see which channels drive the most engaged visitors and revenue.
- Benchmarking: Compare your own trends over time and against typical industry patterns using analytics and external benchmarks.
Key GA4 Metrics to Kn ow
GA4 uses an event-based data model, but these core metrics give you a solid overview of site traffic and behavior.
Example:
If you see high engagement rate and revenue from “Organic Search” but low engagement from “Paid Social,” you might invest more in SEO and refine your social ad targeting and landing pages.
HT Easy GA4
#1 📈 Google Analytics Plugin for WordPress
🚀 Supercharge your WordPress website with analytical insights. (Including WooCommerce Report)
Recommended Blogs for You:
👉 The Best Google Analytics Plugins for WordPress
👉 5 Best WooCommerce Google Analytics Plugins
👉 The Best Affiliate Marketing Software for Startups in 2026
How to Set Up Google Analytics 4 (GA4) for Any Website
Setting up Google Analytics for your WooCommerce site involves a few key steps. Here’s how:
Step 1: Create a GA4 Account and Property
To utilize Google Analytics on your WordPress website, you must first sign up for an account.
1. Go to analytics.google.com and sign in using your Gmail account. If you don’t have one, create it. After logging in, you’ll land on the Google Analytics homepage.
2. Click “Start measuring” to create an account, give it a descriptive account name (e.g., your company name), and adjust data‑sharing settings as needed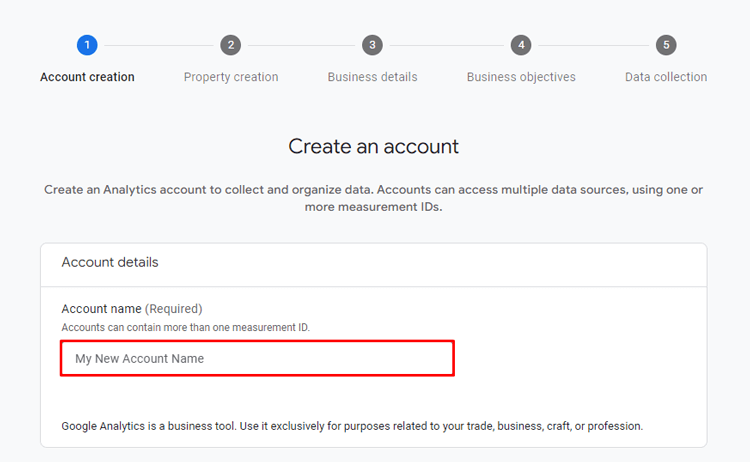
3. Add a new property: enter a property name, select your reporting time zone, and choose your currency.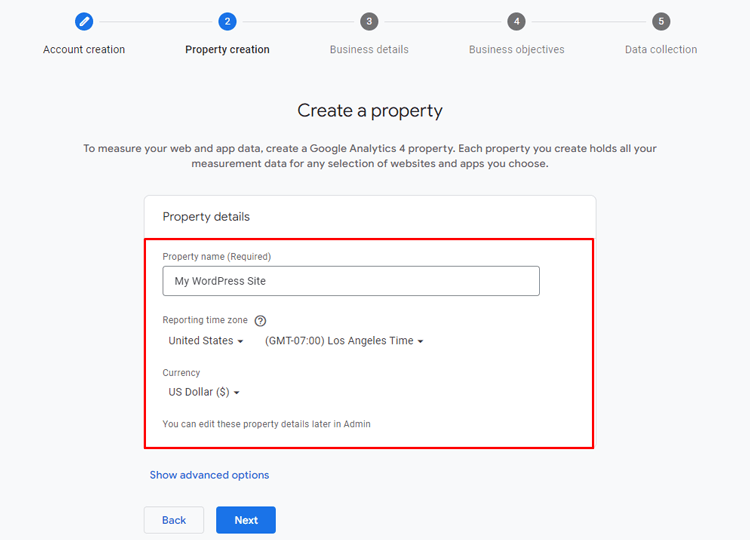
Step 2: Accept Terms and Add a Data Stream
1. Read and accept the terms and privacy policy. Accept the Google Analytics terms and any relevant data processing terms.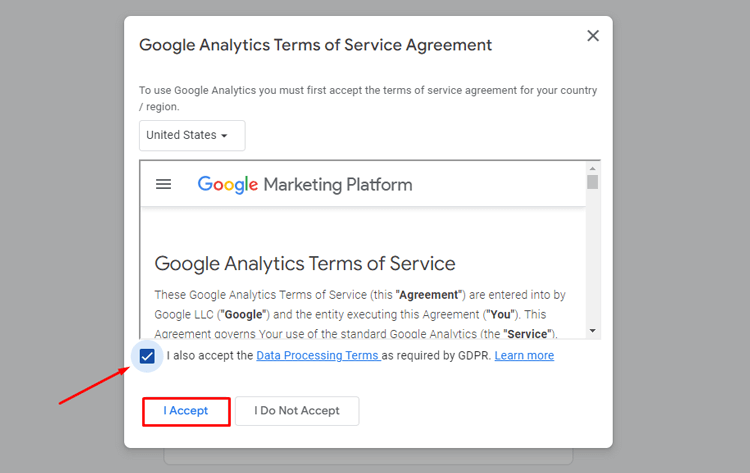
2. Choose platform “Web,” enter your website URL and stream name, then create the web data stream.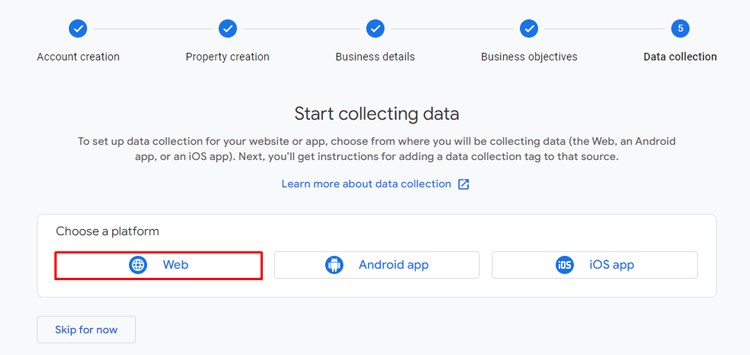
3. GA4 will generate your Measurement ID (formatted like G-XXXXXXXXXX), which uniquely identifies that stream.
Step 3: Add the GA4 Tag (Measurement ID) to Your Site
For non‑WordPress sites, you can either use the GA4 gtag.js snippet or Google Tag Manager.
- Direct gtag.js: Add the provided snippet to your site’s
<head>on all pages. - Tag Manager: Create a GA4 configuration tag with your Measurement ID and publish the container.
If you are on WordPress, using a GA4 plugin like HT Easy GA4 is usually easier and less error‑prone (details later in this article).
Step 4: Verify Data Is Flowing
After you add the tag:
- Visit your website in a new browser window or on your phone.
- In GA4, go to Reports → Realtime and confirm that at least one active user shows (you).
- Wait a few hours to see data populate in standard reports.
After creating the data stream, obtain the Measurement ID, a unique identifier for your site. Integrate it into your WordPress site using a plugin or by manually adding the tracking code to the header. Google Analytics will start tracking data, providing insights through your account.
Navigating the GA4 Dashboard for Traffic Insights
GA4’s Reports area gives you the core traffic and engagement views.
- Reports → Acquisition – Shows how new and returning users find your site, broken down by channel, source/medium, and campaigns.
- Reports → Engagement → Pages and screens – Shows which pages get the most views, engagement, and conversions.
- Reports → Monetization – For eCommerce, shows revenue, items sold, and purchasing behavior.
- Reports → Realtime – Shows active users, locations, sources, and pages in the last 30 minutes.
Tip: Use the date range picker in the top right (e.g., “Last 7 days,” “Last 30 days,” “Compare to previous period”) to track trends over time.
By understanding how to interpret these metrics, you can make informed decisions to optimize your website and improve user experience.
How to Track Website Traffic in GA4
Here’s a simple workflow to see overall traffic and sources in GA4.
1. View Overall Traffic and Channels
- Open GA4 and choose your property.
- Go to Reports → Acquisition → Traffic acquisition.
- Set your desired date range (e.g., last 28 days).
- Look at the table with “Session default channel group” to see traffic by channel—Organic Search, Paid Search, Direct, Referral, Organic Social, Email, etc.
Use this view to answer:
- Which channels send the most sessions?
- Which channels have the highest engagement rate or revenue?
- Are you getting meaningful traffic from search, or mostly direct/brand?
2. Analyze Source/Medium for More Detail
- In the same Traffic acquisition report, change the primary dimension from “Session default channel group” to “Session source/medium.”
- This shows more specific sources like
google / organic,facebook.com / referral,newsletter / email, orcpccampaigns.
If google/organic has strong engagement, SEO is working; if facebook.com/referral has many sessions but low engagement and conversions, consider adjusting those campaigns or landing pages.
Knowing how to track the traffic sources for your website as a whole is vital. But what if you’re interested in analyzing traffic for specific pages using Google Analytics?
How to See Traffic Sources for a Specific Page in GA4
Sometimes you want to know not just site‑wide sources, but exactly where traffic to a particular page comes from.
- Go to Reports → Engagement → Pages and screens.
- Use the search or filter to find the page (by page path or title).
- Once filtered, click the plus icon above the table and choose:
- Traffic source → Session source/medium.
- Now you’ll see rows showing that page’s traffic split by source/medium, including views, users, and engagement metrics.
To see which sources drive first‑time visits to that page:
- In the same table, locate the Event count column.
- Change the event from “All events” to “first_visit.”
- Sort by Event count to see which sources send the most new visitors to that landing page.
Tracking Website Traffic by Device, Location, and More
GA4 lets you segment traffic by device, location, and other dimensions to understand your audience better.
- Device category – Compare desktop vs mobile vs tablet users; if mobile engagement is significantly lower, consider mobile performance and layout fixes.
- Geography – Use demographic or geo reports to see top countries and cities; adapt language, offers, or currency accordingly.
- Engagement by page – Identify pages with a lot of views but low engagement time and conversions, then improve copy, CTAs, or page speed.
For advanced users, you can build Explorations in GA4 for custom funnel or path analysis, but for many WordPress site owners, the standard reports are enough to guide major decisions.
How to Track Website Traffic in WordPress Using HT Easy GA4
For many WordPress users, manually adding GA tags and navigating GA4 can be intimidating; plugins simplify this. HT Easy GA4 is a Google Analytics plugin that connects your WordPress site with GA4 and surfaces easy‑to‑read reports in your dashboard.
According to the plugin’s official page, HT Easy GA4 offers:
WooCommerce eCommerce reports (transactions, revenue, top products) in the Pro version.
Pricing note: HT Easy GA4 has a free version plus paid Personal, Developer, and Agency plans; typical public pricing shown on HasThemes is around $59/year for one site, $99/year for 5 sites, and $199/year for more sites, but always confirm current pricing on the official site.[Verify from official source]
Installing HT Easy GA4 on WordPress
You can install the free version directly from the WordPress plugin directory.
In your WordPress dashboard, go to Plugins → Add New.
Search for “HT Easy GA4.”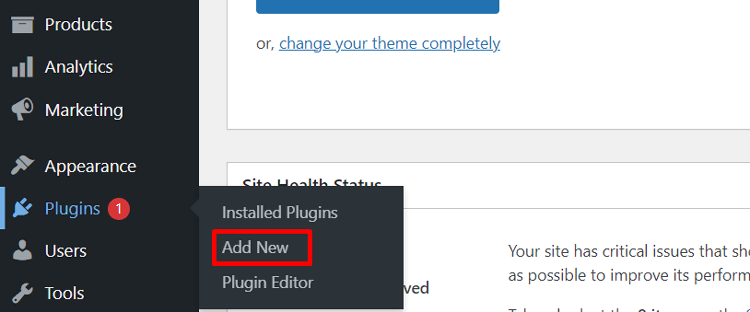
Click Install Now next to “HT Easy GA4 – Google Analytics WordPress Plugin.”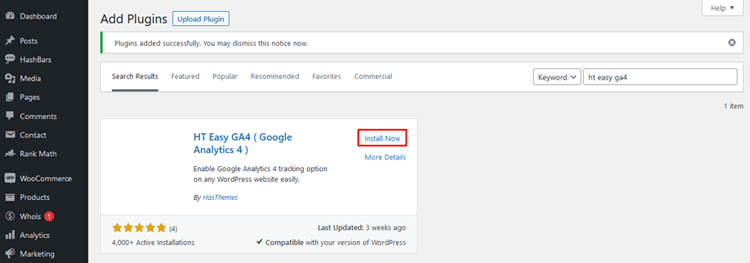
Click “Activate” after installation to enable the plugin. 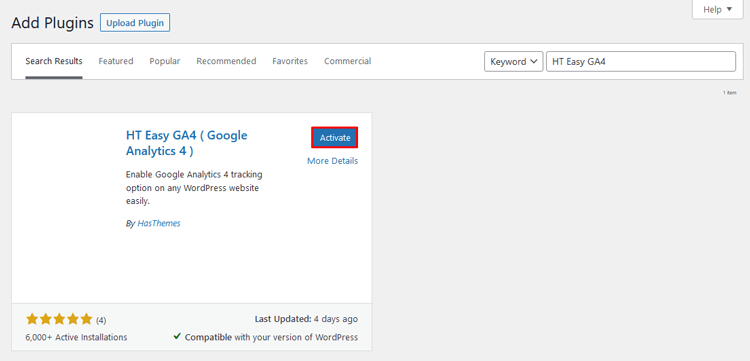
After activated, “HT Easy GA4” will appear in your dashboard menu. Click on it to access its settings and features.
You’re now ready to configure the plugin with your Google Analytics Measurement ID and begin tracking your website’s data seamlessly with Google Analytics 4 (GA4).
Connecting HT Easy GA4 to Your GA4 Property
HT Easy GA4 offers two main ways to connect to GA4
Option 1: Directly Add Measurement ID (Basic)
1. In WordPress, go to HT Easy GA4 → Settings.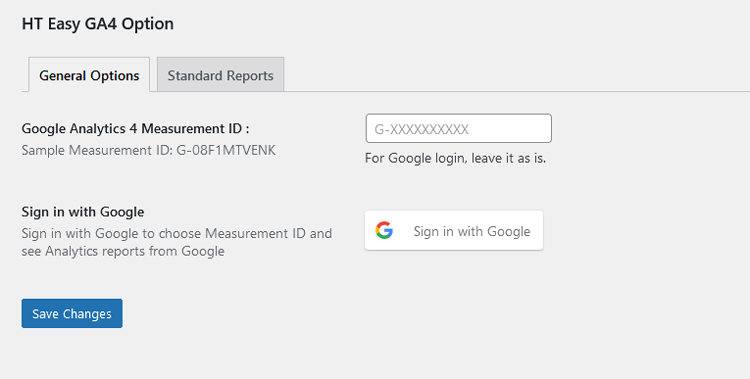
2. Paste your GA4 Measurement ID (from Admin → Data streams in Google Analytics).
3. Save changes; the plugin automatically injects the GA4 tag (gtag.js) into your site header.
This is the fastest way to start collecting traffic data if you already created a GA4 property.
Option 2: Sign in With Google (Recommended)
1. In HT Easy GA4 settings, click “Sign in with Google.”
2. Choose the Google account that owns your GA4 property.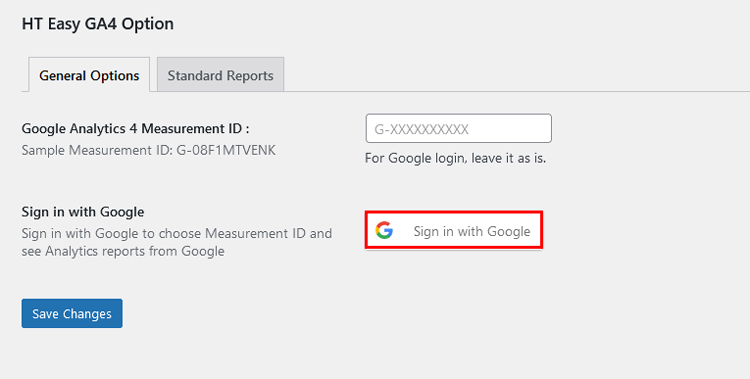
3. Grant the requested permissions so the plugin can read analytics data.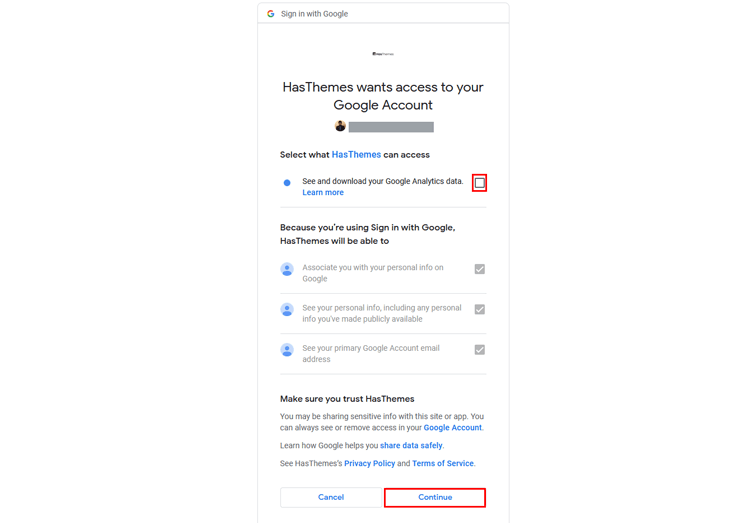
4. After connection, select the GA account, property, and data stream/Measurement ID from dropdowns.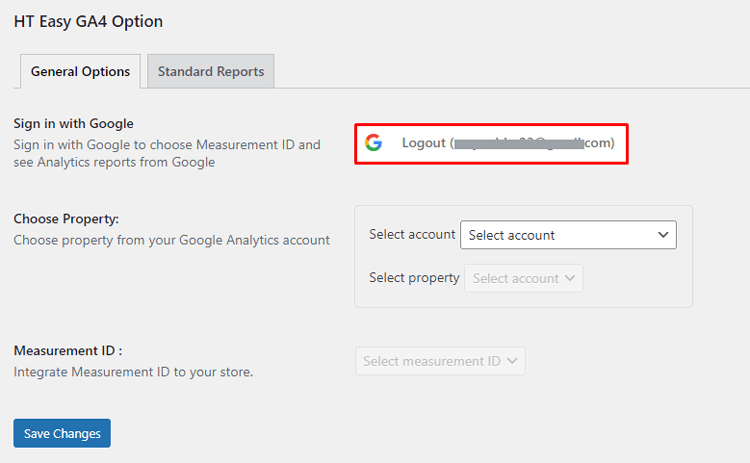
5. Save settings; the plugin adds the tracking code and enables in‑dashboard reporting.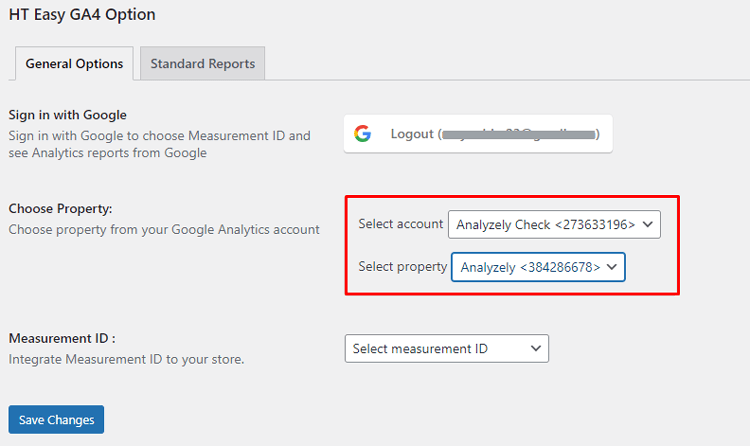
If you previously added GA tracking manually or via another plugin, remove those codes to avoid double‑counting.
Completing the HT Easy GA4 Configuration After Google Login
Once you’ve logged in with your Google account and granted access, HT Easy GA4 will ask you to choose which Analytics resources to use for this WordPress site.
Select Account and Property
- In the HT Easy GA4 settings screen, locate the Select Account dropdown.
- Choose the Google Analytics account that contains the GA4 property for your WordPress site.
- After selecting the account, the plugin will load and display the available properties for that account.
- Use the Select Property dropdown to choose the correct GA4 property for this website.
This step ensures the plugin is connected to the right Google Analytics account and property, which is especially important if you manage multiple sites or clients.
Choose Measurement ID (Data Stream)
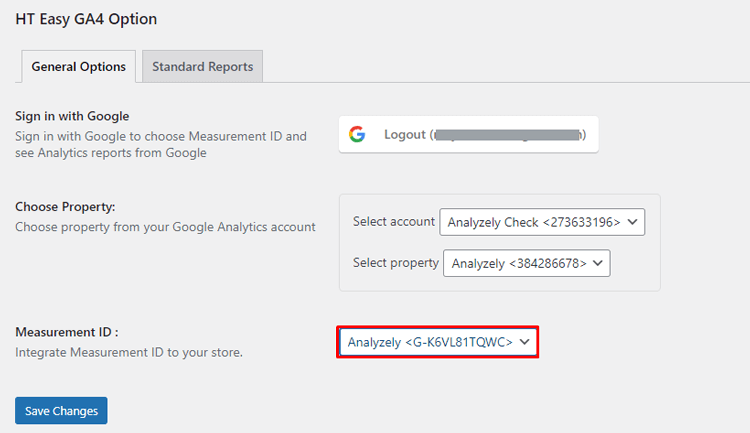
- Once the property is selected, you’ll see a Data stream or Measurement ID dropdown.
- Choose the desired GA4 web data stream for your site; the corresponding Measurement ID (for example,
G-XXXXXXXXXX) will appear automatically. - Confirm that this Measurement ID matches the one shown in GA4 under Admin → Data Streams for your website.
Save the Configuration
- After account, property, and Measurement ID are set, click Save (or the plugin’s equivalent “Save changes” button).
- HT Easy GA4 will now automatically add the GA4 tracking code to your site’s header so visitor data starts flowing into your Google Analytics account.
- If you previously added GA tracking manually, via theme, or another plugin, remove those codes to avoid duplicate tracking and inflated metrics.
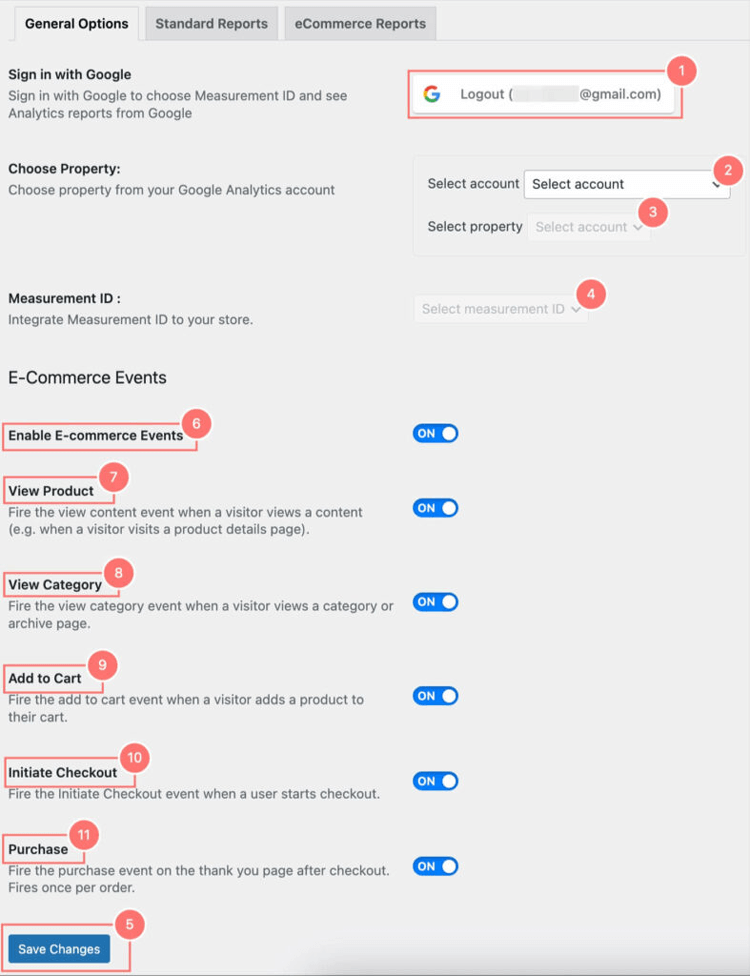
Enable E-Commerce Events (Pro):
If you’re running a WooCommerce store, the Pro version of HT Easy GA4 unlocks dedicated e‑commerce event tracking for GA4.
With HT Easy GA4 Pro and WooCommerce active, you can:
- Enable tracking for key eCommerce events such as View Product, View Category, Add to Cart, Initial Checkout, and Purchase.
- Send these events to GA4 so you can analyze product performance, sales funnels, and revenue.
This allows you to answer questions like:
- Which products get many views but few purchases?
- At what stage (view, cart, checkout) are users dropping off?
- Which traffic sources bring the highest‑value customers?
By using the e‑commerce events, you can systematically optimize offer placement, pricing, and on‑site UX to improve conversions and revenue.
The HT Easy GA4 plugin offers a range of event tracking features, including “View Product,” “View Category,” “Add to Cart,” “Initiate Checkout,” and “Purchase.” These features enable you to monitor user engagement with your products and website effectively.
Navigating the HT Easy GA4 Interface
After configuration, HT Easy GA4 fetches GA4 data and displays it in easy‑to-read dashboards inside your WordPress admin. There are two main report areas: Standard Reports and E‑commerce Reports (Pro).
Standard Report
HT Easy GA4 streamlines the generation and interpretation of standard reports, providing valuable insights for data-driven decision-making. Here’s a detailed look at the standard reports provided by HT Easy GA4:
Account Information:
- Email Account and Measurement ID: This section shows the email account you are logged into and the specific measurement ID for the report.
Date Range and Comparison:
- Default 30-Day Data: Reports display default data for the last 30 days.
- Custom Date Range: You can choose a custom date range to view data for different periods.
- Data Comparison: Compare current reports with previous data to evaluate your website’s performance over time.
Key Metrics:
- Sessions: A session comprises user interactions within a specific period. It helps track user behavior trends on your website.
- Page Views: This metric counts how often pages on your website are viewed, indicating page popularity and traffic sources.
- Bounce Rate: The percentage of users who leave your site after viewing only one page. This helps identify pages that may need better engagement strategies.
- Top Pages: Lists the most viewed pages on your site, helping identify and promote popular content.
- Top Referrers: Shows the websites sending the most traffic to your site, aiding in optimizing marketing campaigns.
- Top Countries: Identifies the countries your users are coming from, helping tailor your website and marketing strategies to different geographic audiences.
- User Types: Categorizes different segments of your audience, allowing for targeted marketing and website adjustments.
- Device Types: Reports on the types of devices used to access your website, helping optimize the user experience across different platforms.
eCommerce Report(Pro)
The E‑commerce Report, available in HT Easy GA4 Pro with WooCommerce, focuses on sales and product performance.
Here’s an organized overview of what these reports offer:
Account Information:
- Logged-in Account and Measurement ID: This shows the email account used and the measurement ID for the report.
Date Range and Comparison:
- Default 30-Day Data: Displays data for the last 30 days by default.
- Custom Date Range: Allows a custom date range selection to view data for different periods.
- Comparison Feature: Enables comparison with previous data to assess performance over time.
Key E-commerce Metrics:
- Transactions: Tracks the number of sales made on your website, helping to identify sales trends.
- Average Purchase Revenue: This metric indicates the average amount spent per purchase, enabling the identification of profitable products and the optimization of marketing campaigns.
- Total Purchase Revenue: Displays the total revenue generated, useful for tracking overall performance and revenue trends.
- Product Viewed: Reports the number of views each product receives, helping to identify popular products.
- Products Added to Cart: Tracks how often each product is added to the cart, aiding in identifying products that attract potential buyers.
- Products Checked Out: Shows the number of times products are purchased, helping to identify high-demand products.
- Product Purchase Quantity: Displays the number of units sold for each product, aiding in inventory management.
- Top Products: Lists the most sold products, helping to identify and promote best-sellers.
- Top Referrers: Shows the websites driving the most traffic that results in purchases, guiding marketing efforts to maximize effective traffic sources.
Common Mistakes and Troubleshooting (GA4 + HT Easy GA4)
Your existing troubleshooting list is solid; it also aligns with typical GA4 issues. You can keep it and lightly adjust wording:
Common mistakes and troubleshooting when using Google Analytics:
- Incorrect or duplicate tracking code – Ensure only HT Easy GA4 (or one method) injects the GA4 tag to avoid double‑counting.
- Not using filters / internal traffic exclusion – Exclude admin and internal IPs to keep data clean.
- No conversion setup – In GA4, mark important events as conversions (submit lead, purchase, etc.) so reports reflect business goals.
- Out‑of‑date settings – Periodically review property settings like time zone, currency, and data retention.
- Ignoring sampling and thresholds in GA4 explorations – For most site owners, standard reports are more reliable and easier to interpret
Frequently Asked Questions
How do I measure my website traffic with GA4?
Create a free GA4 property in Google Analytics, add the GA4 tag or Measurement ID to your site, then use Reports → Acquisition and Reports → Engagement to see users, sessions, pages, and conversions over your chosen date range.
How does GA4 track traffic sources?
GA4 records traffic source data (like source/medium and campaign) when a user lands on your site, then reports it in Acquisition → User acquisition and Traffic acquisition with dimensions such as session default channel group and session source/medium.
Does Google Analytics track social media?
Yes, Google Analytics captures social media traffic by tracking referrals from social platforms. This enables you to analyze the performance of your social media campaigns and understand how users interact with your content.
Does GA4 track social media traffic?
Yes, GA4 tracks visits from social networks as “Organic Social” or “Paid Social” channels, and you can see detailed sources (e.g., facebook.com/referral, instagram.com / referral) in the Traffic acquisition report.
Does Google Analytics capture all website traffic?
Google Analytics captures most measurable web traffic, but some visits can be missing or under‑reported due to ad blockers, tracking consent choices, restricted environments, or incorrect tag setups. Ensuring a correct GA4 implementation and respecting privacy requirements will maximize reliable data.
Is Google Analytics free?
The standard Google Analytics 4 property is free to use and suitable for most websites. Google Analytics 360 is a paid enterprise edition with advanced features and higher limits, with pricing typically negotiated via sales partners.
Can I view GA4 data inside WordPress?
Yes, WordPress plugins like HT Easy GA4 can connect to your GA4 property and display standard and eCommerce reports in your WordPress dashboard, so you don’t have to log into Google Analytics each time.
How do I track WooCommerce sales in GA4?
Enable eCommerce tracking in GA4 and use a plugin such as HT Easy GA4 Pro to send WooCommerce events (view item, add to cart, begin checkout, purchase) to GA4 and show revenue reports inside WordPress.
Conclusion
Tracking website traffic with Google Analytics 4 gives you the clarity you need to improve content, design, and marketing decisions for any WordPress or WooCommerce site. By understanding where visitors come from and how they behave, you can focus on the pages and campaigns that actually drive results.
The HT Easy GA4 plugin allow you connect GA4 to WordPress in just a few clicks and view standard and e‑commerce reports directly inside your dashboard, without touching code or hunting through complex GA4 menus. That makes accurate analytics accessible, even if you’re not an analytics specialist.
Once GA4 is set up and HT Easy GA4 is configured, you can monitor traffic trends, top pages, devices, and WooCommerce sales at a glance, then adjust your content and campaigns based on real data.
Over time, those small, data‑driven improvements compound into better user experience, stronger conversions, and sustainable digital growth.
If you haven’t already, start by creating your GA4 property, installing HT Easy GA4, and reviewing your key traffic reports for the last 30 days—this alone will reveal where to focus next on your site.
Don’t delay any further – act now to begin unlocking the advantages of monitoring website traffic through Google Analytics!